Using Reports
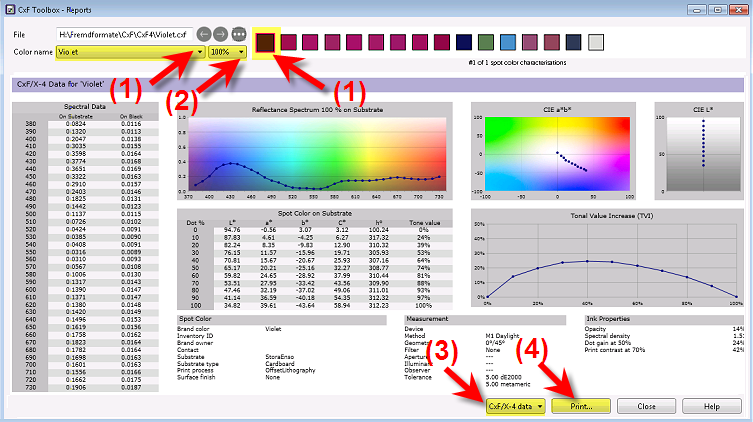
Select the spot color and tint value the data of which should appear in the report. The spectral reflectance chart can be enlarged and viewed in detail. The current view can be printed.
- If the file contains more than one CxF/X-4-defined color, select a color from the Color name list or click on the color box.
- If various tint values are defined for this color, select a tint value from the list
 .
. - Use the list at the bottom to switch between different report types:
Report on CxF/X-4 colors
Large chart with spectral curves for all tint values
Validation report (only possible if measurements were made for the selected color)
- Click the Print button to print the report with the charts that are currently displayed on the screen.
- Refer to the Reports section if you need help with understanding the various charts and tables.
Example
Using a CxF/X-4 Report