Viewing Spectral Curves and Metadata
You can inspect spectral reflectance curves and CxF/X-4 metadata information in a safe mode. In this mode all metadata fields are write-protected and cannot be changed. This tool allows you to load CxF1, CxF2, CxF3, CxF/X-4, QTX and PDF files as well as CGATS measurement files.
- If the
 tool is not available, click
  and enable it.
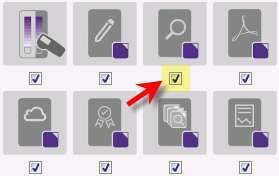
- Click on the left of the main window.
- Load the files to be analyzed:
Drag a CxF1, CxF2, CxF3, CxF/X-4, CGATS or QTX file onto the ORIS CxF Toolbox window.
Click
 and select such files or PDF/X files. Hold the Shift or Ctrl key pressed down to select multiple files.
Use
 and
and  to successively load all files of the selected type available in the current folder (only one at a time).
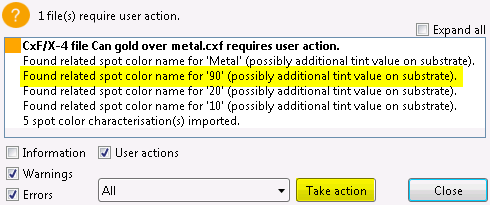
- If a log window appears, click on the messages to see more details, then close the window.
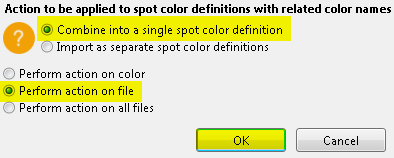
If a user action is required, however, click on the message details. Then click on a color name, select the action and specify whether to apply it to all colors or all files. Then click OK and close the window.
The following situations require a user action, for example:
Spot colors with invalid spectral data. Such definitions can be discarded.
Spot colors with similar names interpreted as different tint values of the same color. Example: Blue, Blue10, Blue20 … Blue90. Such colors can be combined into a single color.
Spot colors with similar names interpreted as identical tints of the same color, one printed on the substrate and one on black. Example: Blue and Blue_K. Such colors can also be combined.

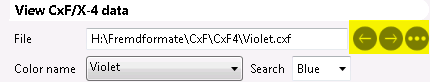
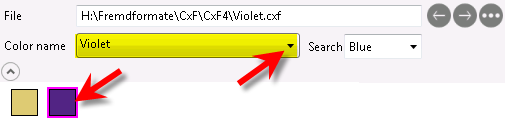
- Select a CxF/X-4 color definition using the Color name list or by clicking on the color box underneath the list. Click the
 button if the color boxes are not visible.
If the color list is long, enter parts of the name into the Search box. The color will be selected automatically. If your input matches more than one name, you can select from a list that contains only names that match your input.
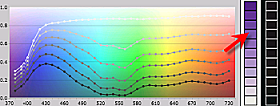
- To inspect the spectral curves, click on a patch in the tint ramp. Ctrl-click to add the spectral curve to those displayed already.
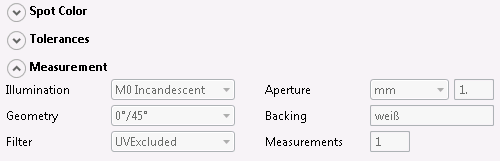
- Click the buttons to expand the metadata groups if required.
Alternatives
There are additional tools which allow you to view CxF/X-4 data in a write-protected mode. Examples:
- Click
 , then
  . See also Managing CxF/X-4 Data in PDF Files.
 - Click
 , then
  . See also Print Validation (Certification).
 - Click
 , then . See also Print Validation of GBA Jobs (Certification).
