Understanding Reports on CxF/X-4 Colors
Explanation of Figures
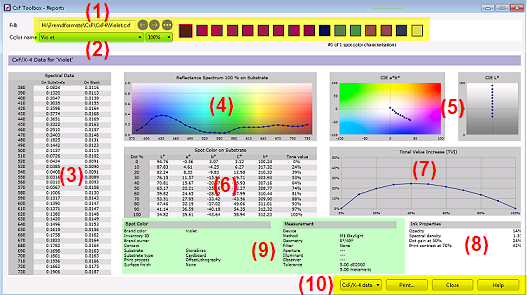
- (1) File selection
Load CxF/X-4 color definitions if the dialog is empty:
- (2) Color and tint selection
Select a CxF/X-4 color definition from the list at the top or by clicking on a color box displayed next to the list.
The list contains the color definitions you have loaded here or that were loaded in ORIS CxF Toolbox before this dialog was opened.
If various tint values are defined for this color, select a tint value from the list
 .
.- (3) Spectral reflectance data for selected color and tint value
Left: Wavelength of incident light in nanometers.
Center: Portion of light reflected by color printed on substrate (1,0 = 100%).
Right: Portion of light reflected by color printed on black.
- (4) Spectral reflectance curve for selected color and tint value
Graphical representation of table (3) for color printed on substrate.
X-axis: Wavelength of incident light in nanometers.
Y-axis: Portion of reflected light (1,0 = 100%)
Curve points: Nanometer values listed in table (3)
- (5) CIE a*b* and L* charts
CIE Lab values of all tint values listed in table (6) plotted as:
Hue (a*b*) chart
Lightness (L*) chart
- (6) Colorimetric data for selected color printed on substrate
For each tint value, calculated from the spectral data:
CIE L*a*b* (lightness, red/green hue, blue/yellow hue)
CIE L*C*h° (lightness, chromaticity, hue angle)
Tone value increase (TVI)
Size to which a printing dot is expected to increase in the print run. Example: A size of 55% is expected for a 50% dot (which means a dot gain of 5%).
- (7) Tone value increase chart
X-axis: Original printing dot sizes for all tint values of the spot color.
Y-axis: Increased dot sizes expected in the print run, as indicated in table (6).
- (8) Ink properties
Specifications of ink properties intended for ink suppliers, calculated from spectral data measurements.
Opacity
Ratio of lightness values of 100% tint printed on substrate and 100% tint printed on black.
0% means: Ink is invisible when printed on black. 100% means: Ink is completely opaque.
Spectral Density
Ink density of 100% tint printed on substrate.
Dot gain at 50%
Dot gain value for a 50% tint, derived from the TVI value. See also glossary.
Print contrast at 70%
Ratio of ink densities for 70% and 100% tints calculated as follows: (1–D70/D100)*100
0% means: 70% tint has same density as 100% tint. 100% means: 70% tint is invisible.
- (9) CxF/X-4 metadata
Information that identifies the spot color and how it was measured, stored in the metadata of the CxF/X-4 file.
- (10) Buttons
The button on the left allows you to switch between the following:
CxF/X-4 data
Report on CxF/X-4 colors.
Spectral data
Spectral curves for all tint values of selected CxF/X-4 color printed on substrate. Large chart that fills the entire window area.
Certification
Validation report.
Setting only available if validation measurements were made for selected CxF/X-4 colors
Click the Print button to print the report with the charts that are currently displayed on the screen.
