Understanding Validation Reports
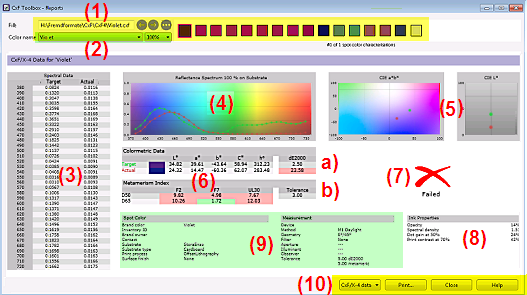
Explanation of Figures
- (1) File selection
Click
 to load validation results saved as a PQX file.
Use
 and
and  to successively load all files with the currently selected type available in the current folder.Note:
Validation results are only displayed if you load a single PQX file. If you select multiple files and PQX files are among them, the report will include the CxF/X-4 color definitions stored in these PQX files, but validations results will be ignored. The report will therefore be as explained in section Understanding Reports on CxF/X-4 Colors.
- (2) Color and tint selection
Select a CxF/X-4 color definition from the list at the top or by clicking on a color box displayed next to the list.
If various tint values are defined for this color, select a tint value from the list
 .
.The spectral data and colorimetric data for the selected color and tint value will appear in the dialog.
- (3) Spectral reflectance data for target and actual values
Left: Wavelength of incident light in nanometers.
Center: Portion of reflected light defined by CxF/X-4 data (
 target values).
Right: Portion of reflected light that was measured (
 actual values).
- (4) Spectral reflectance curves for target and actual values
X-axis: Wavelength of incident light in nanometers.
Y-axis: Portion of reflected light (1,0 = 100%)
Curves for CxF/X-4 data (
target values) and measurement ()Curve points: Nanometer values listed in table (3)
- (5) CIE Lab charts
Colorimetric values of table (6a) plotted as:
Hue (a*b*) chart
Lightness (L*) chart
Two points:
CxF/X-4 data; measurement- (6a) Colorimetric data
For
CxF/X-4 data and measurement, calculated from spectral data:CIE L*a*b* (lightness, red/green hue, blue/yellow hue)
CIE L*C*h° (lightness, chromaticity, hue angle)
Validation result:
Color deviation with pass/fail indication (red/green background)
Tolerance value
- (6b) Metamerism index (MI)
Calculated from the deviations between
CxF/X-4 color and measured color viewed under different illuminants:MI values with pass/fail indication (red/green background)
Tolerance value
MI validation is successful if all MI values are within this tolerance limit (green)
- (7) Overall pass/fail indication
The icon indicates the overall validation result:

Passed:
All validation results are OK (both the dE value and all MI values)

Failed:
At least one validation result is not OK (delta E, one or more MI values, or both)
- (8) Ink properties
Specifications of ink properties intended for ink suppliers, calculated from spectral data measurements.
Opacity
Ratio of lightness values of 100% tint printed on substrate and 100% tint printed on black.
0% means: Ink is invisible when printed on black. 100% means: Ink is completely opaque.
Spectral Density
Ink density of 100% tint printed on substrate.
Dot gain at 50%
Dot gain value for a 50% tint, derived from the TVI value. See also glossary.
Print contrast at 70%
Ratio of ink densities for 70% and 100% tints calculated as follows: (1–D70/D100)*100
0% means: 70% tint has same density as 100% tint. 100% means: 70% tint is invisible.
- (9) CxF/X-4 metadata
Information that identifies the spot color and how it was measured, stored in the metadata of the CxF/X-4 file.
- (10) Buttons
The button on the left allows you to switch between the following:
CxF/X-4 data
Report on CxF/X-4 colors.
Spectral data
Spectral curves for all tint values of selected CxF/X-4 color printed on substrate. Large chart that fills the entire window area.
Certification
Validation report.
Setting only available if validation measurements were made for selected CxF/X-4 colors
Click the Print button to print the report with the charts that are currently displayed on the screen.
